
Case study · Municipality of Medulin · 2026 season

102 days. 5 beaches. Real data.

During the summer season, OPSIGNIA was used to document conditions and safety every day on five beaches in the Municipality of Medulin.

Request a demo
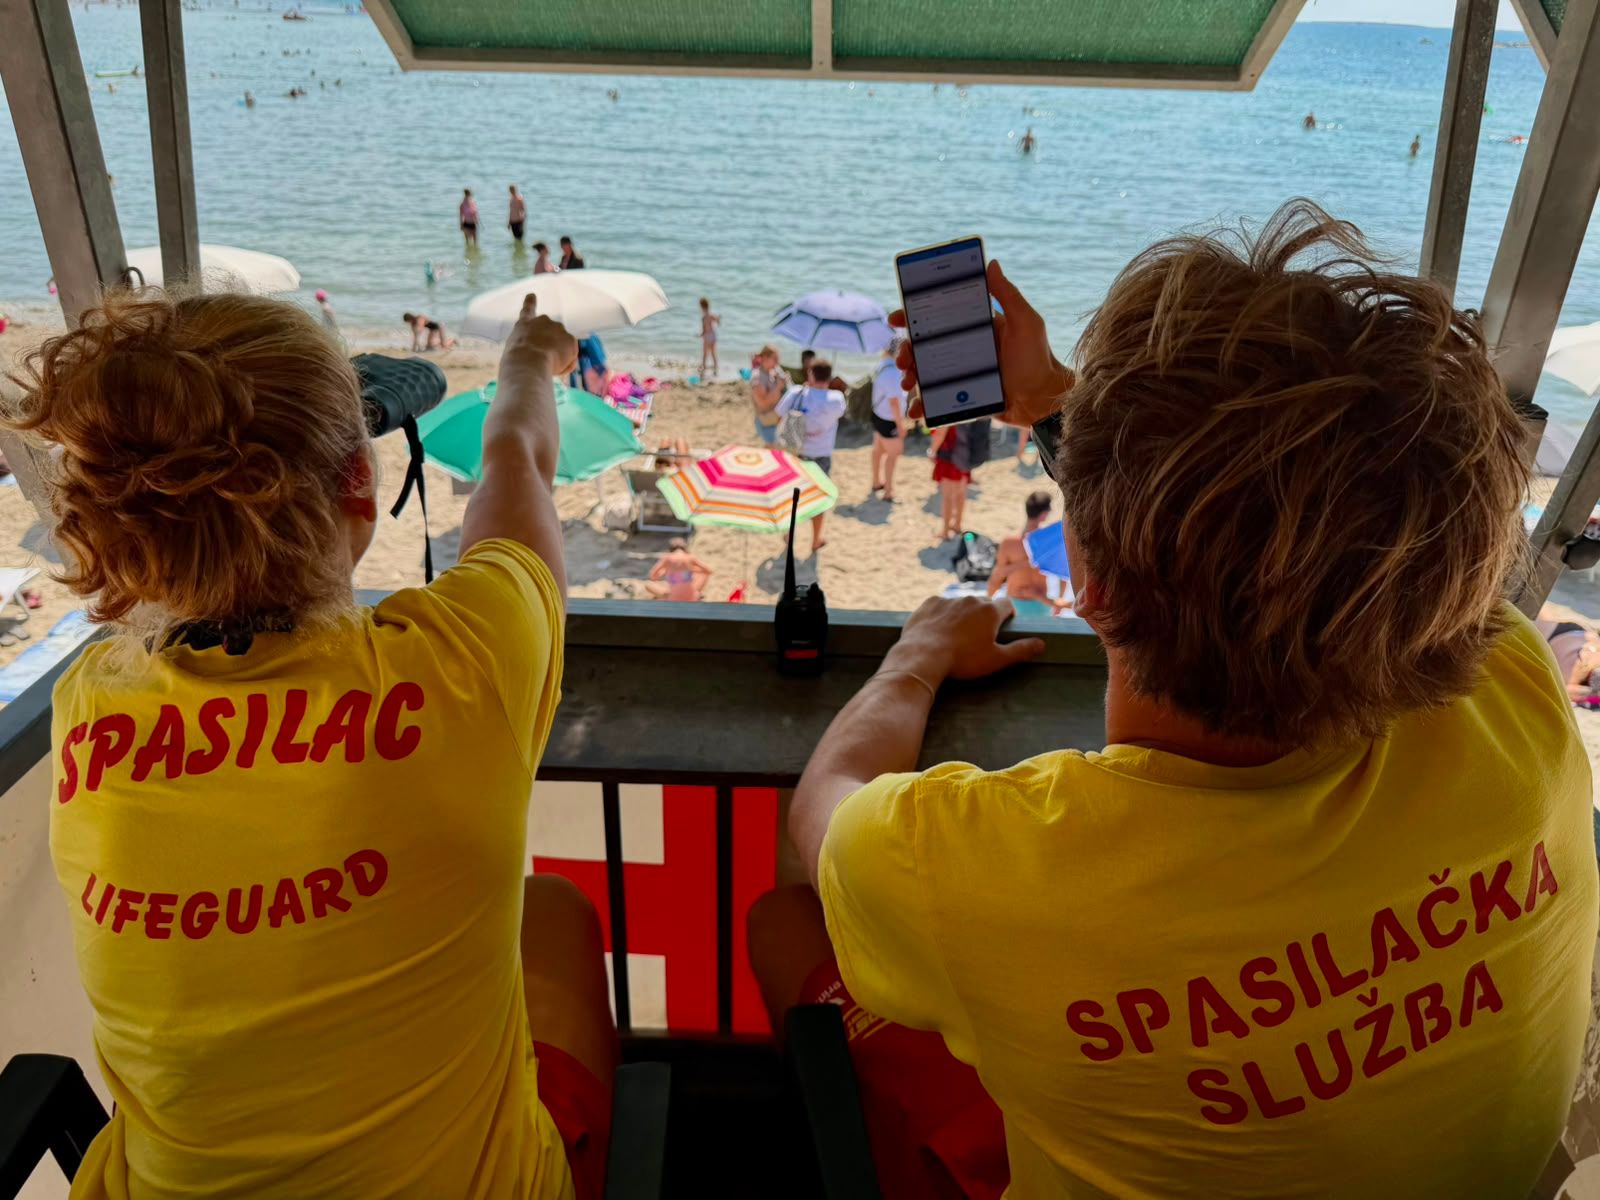
Lifeguards on a tower monitoring a beach, one of them using the OPSIGNIA app on a phone

Pilot delivered in cooperation with the Municipality of Medulin

Municipality of Medulin logo
days
102
beaches
5
lifeguards
15
documented interventions
162
estimated visitors*
107,594
of interventions resolved on site**
92%

Aggregated data for the entire season 5 June – 14 September 2026.

* Estimate, not a count of individual people. Occupancy is recorded four times a day, and the platform calculates an estimate of total visitors from it.

** Resolved on the beach, without a doctor, emergency medical service or police.

What does the beach data tell us?

When condition and safety data is collected throughout the season, patterns become visible that individual records cannot show.

Risk is not equal across beaches

The least-visited beach had the highest intervention rate.

Interventions per 1,000 visits

0
0.5
1
1.5
2
2.5
3
3.5
0 10k 20k 30k 40k
T3
T4
T5
T6
T7

Estimated visits

Vertical lines show the uncertainty of each rate (95%).

Interventions per 1,000 estimated visits, by beach. Beach T5 (≈9,000 visits) has a rate of 2.1 — more than double the busiest beaches T6 and T7 (≈35,000 visits, rate about 0.9).

Conclusion

The number of people on a beach is not enough to understand its safety situation.
Most common does not mean most severe

The 65+ age group accounts for about 6% of interventions. 40% of them are severe cases.

0%
25%
50%
75%
100%
55
0–10
27
10–18
36
18–35
20
35–50
6
50–65
10
65+

Age group

  • Minor
  • Moderate
  • Severe or water rescue
Number of interventions by age group (people with a recorded age), split by severity; water rescues count as severe cases. The 0–10 age group has the most interventions (55), almost all minor. The 50–65 and 65+ groups have the fewest (6 and 10), but the highest share of moderate and severe cases.

Conclusion

About a third of interventions involve children under 10. More serious incidents are concentrated in the smaller group of older guests.

Every beach tells its own story

32% of stings happen on one beach.

Beach T3
34%
43%
23%
n=35 Beach T4
50%
44%
n=36 Beach T5
35%
59%
n=17 Beach T6
57%
29%
n=28 Beach T7
81%
n=31
0%25%50%75%100%

Share of injuries

  • Animal stings (sea urchins)
  • Open wounds (cuts)
  • Other injuries
Injury structure by beach, as a share of that beach’s total injuries. Animal stings account for 57% on T6, while open wounds account for 81% on T7.

Conclusion

Every beach has its own risk profile.

What does this mean for beach management?

  • An overview of every location in one place

    Data from every beach is available in one system instead of individual records and reports.

  • Pattern recognition

    Continuous data collection makes it easier to spot differences between locations, periods and event types.

  • Decisions based on data

    Real beach data provides a stronger basis for day-to-day and long-term decisions.

How did it work before?

Data existed before the platform was introduced, but much of it remained in paper-based and disconnected records — making it harder to review, compare and use.

Everyday work

Valuable information about beach activity is created every day.

Fragmented records

Data was collected through daily records, but was not consolidated in one place.

A visibility problem

Manual consolidation made season review and comparison across beaches and periods difficult.

How we enabled it

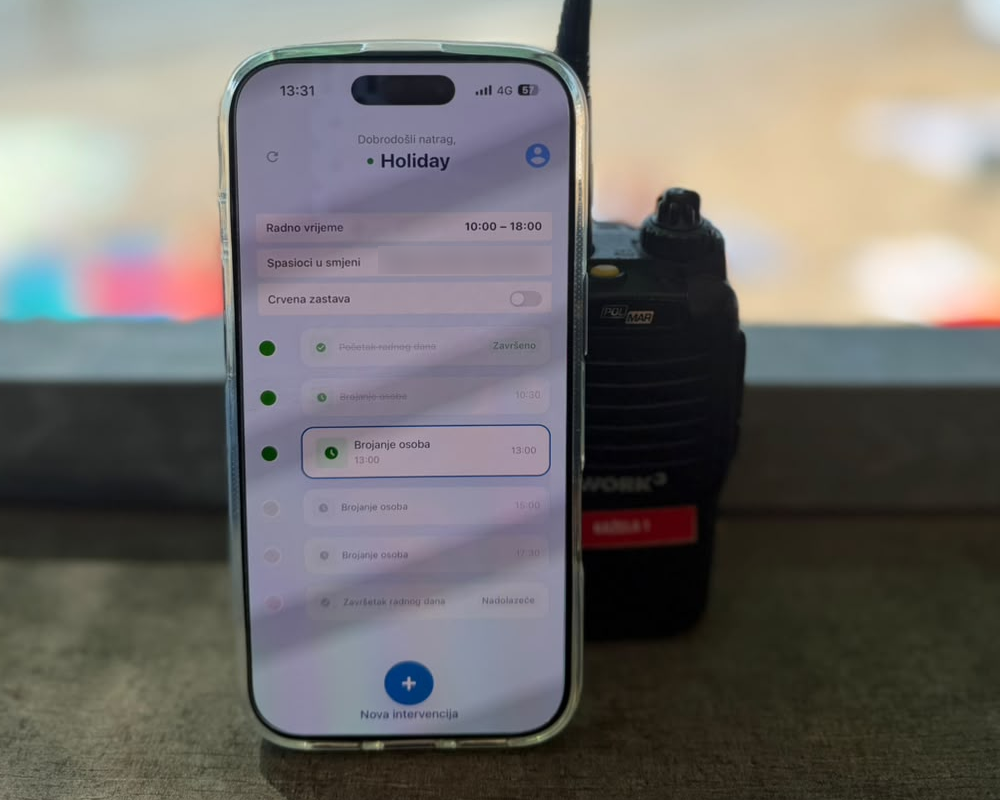
Documentation → structured data → review and analysis. Everyday activities are recorded on the beach, and the data is automatically consolidated and made available to the organization.

OPSIGNIA mobile app on a smartphone on a lifeguard tower

01

The lifeguard records

Data starts on the beach

Key data about beach events is recorded every day through the mobile application.

  • Attendance four times a day
  • Interventions immediately after an event
  • Beach conditions and red flag
  • Data for the daily report
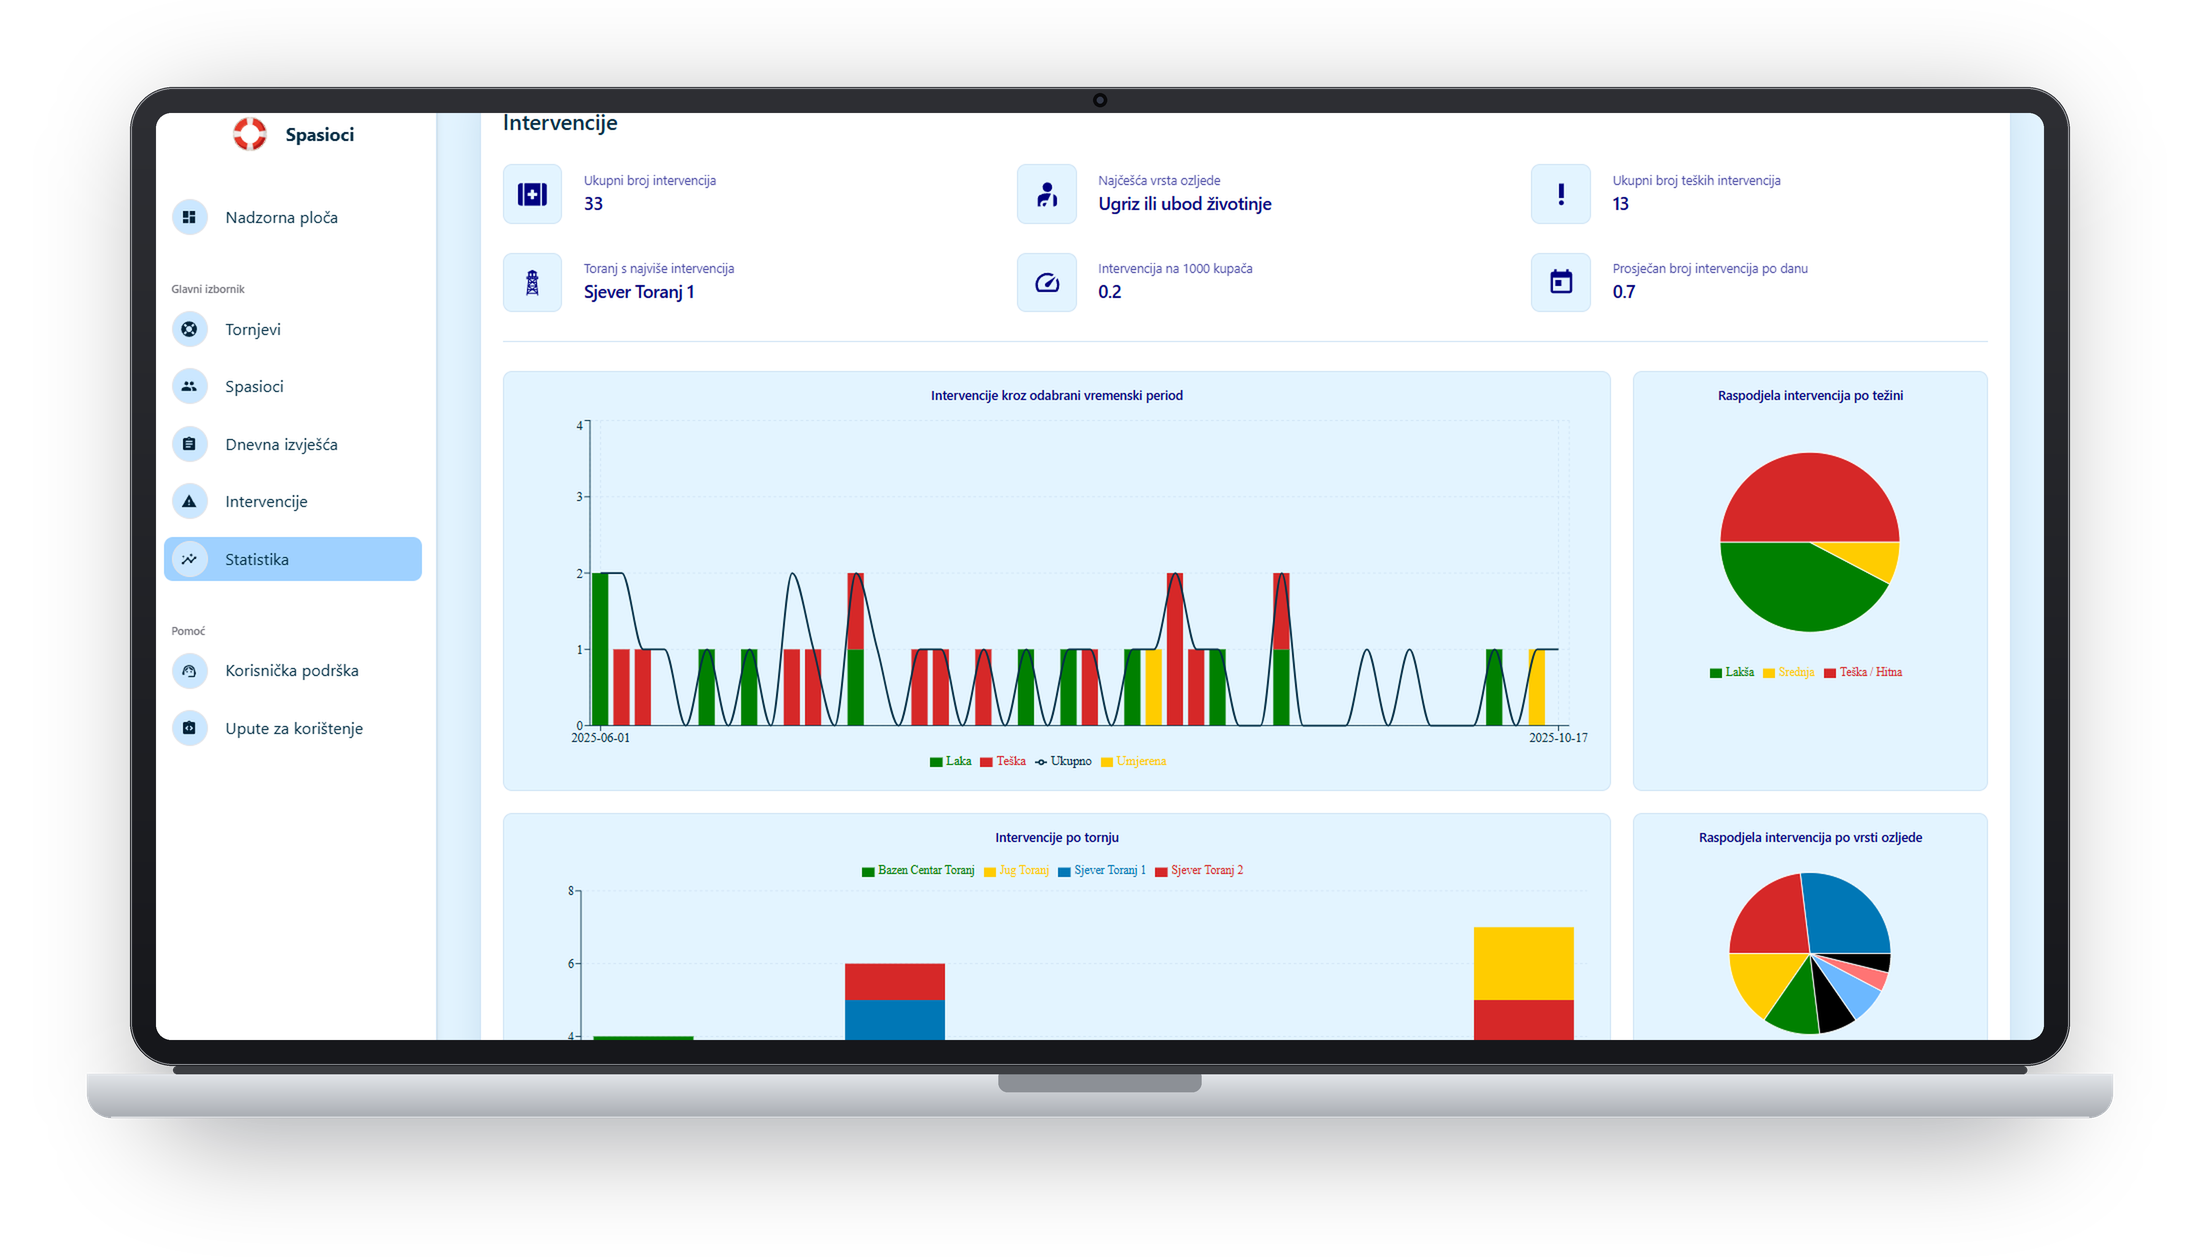
OPSIGNIA platform dashboard with intervention statistics

02

The organization understands

Data becomes a basis for management

The web interface provides a clear picture of beach conditions and safety.

  • What is happening today?
  • What happened during the season?
  • What repeats?
  • What can we conclude from it?

Start a conversation

Want to see how OPSIGNIA would work at your aquatic sites?

Let’s talk about how you work today and the data you need.